 info@example.com
 Rock Street, San Francisco

Still haven’t found the best RSI indicator setting for the 5 minute chart? Or do you think that the RSI indicator setting of profitable traders is something special?
We have tried a lot of different indicators by applying different settings. we also talked to different traders and got to know about their settings, which are the best RSI settings for 5 min chart, and which ones they prefer to use to start investing with.
But most of the time RSI indicators are widely used in a sideways market. But if the traders have a better understanding of the RSI indicator they use this indicator in also trending markets.
And that’s why we have done our research. We have found out the best RSI indicator settings that work better. but we have come up with different options for each market condition. You can use these in your setup.
You will find answers to these questions in this article.
- Best RSI Indicator Setting in a Sideways Market?
- Best RSI Indicator Setting in a Trending Market?
- Best RSI Indicator Setting in a Highly Volatile Market?
- Do Profitable Traders Believe in the Best RSI Settings?
Let’s Dig Deeper: –
RSI Introduction
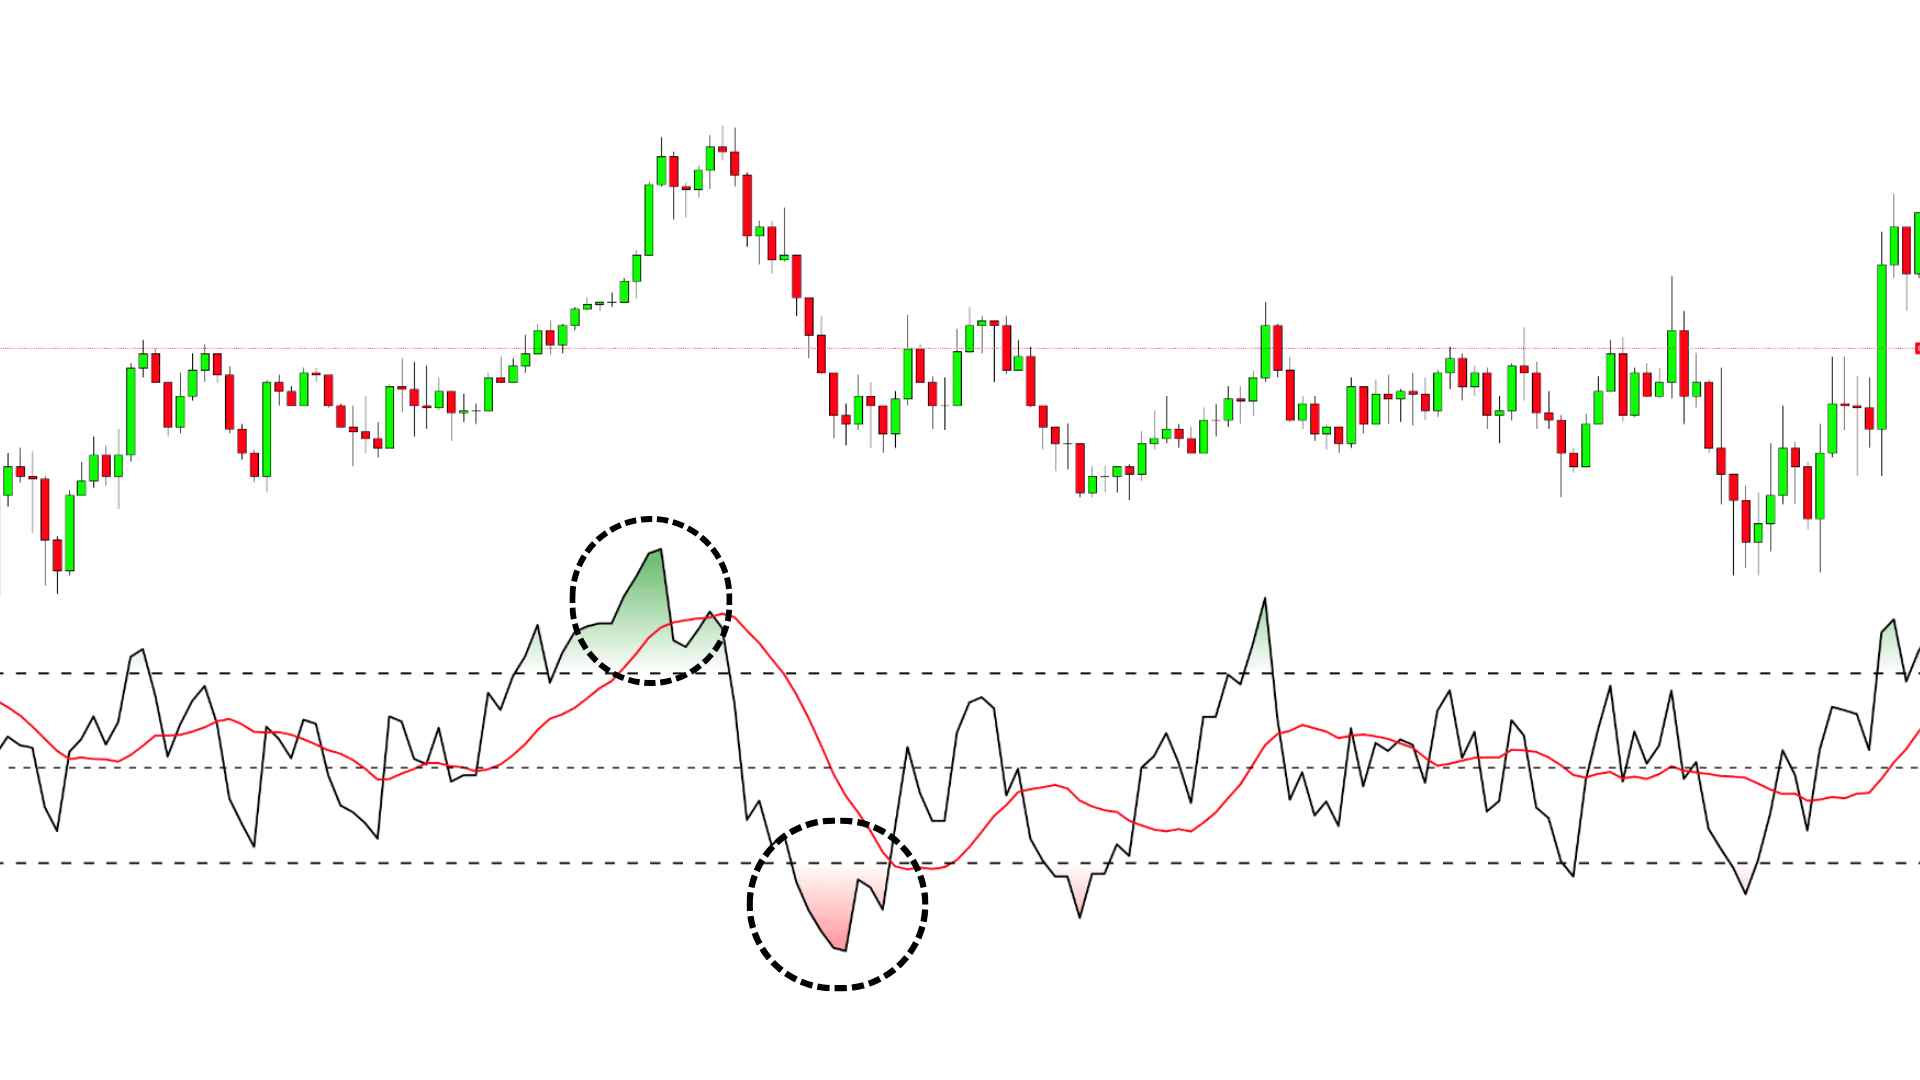
The RSI indicator helps to indicate when the price is undervalued (below 30) or overvalued (above 70) of the assets using their low or high levels.
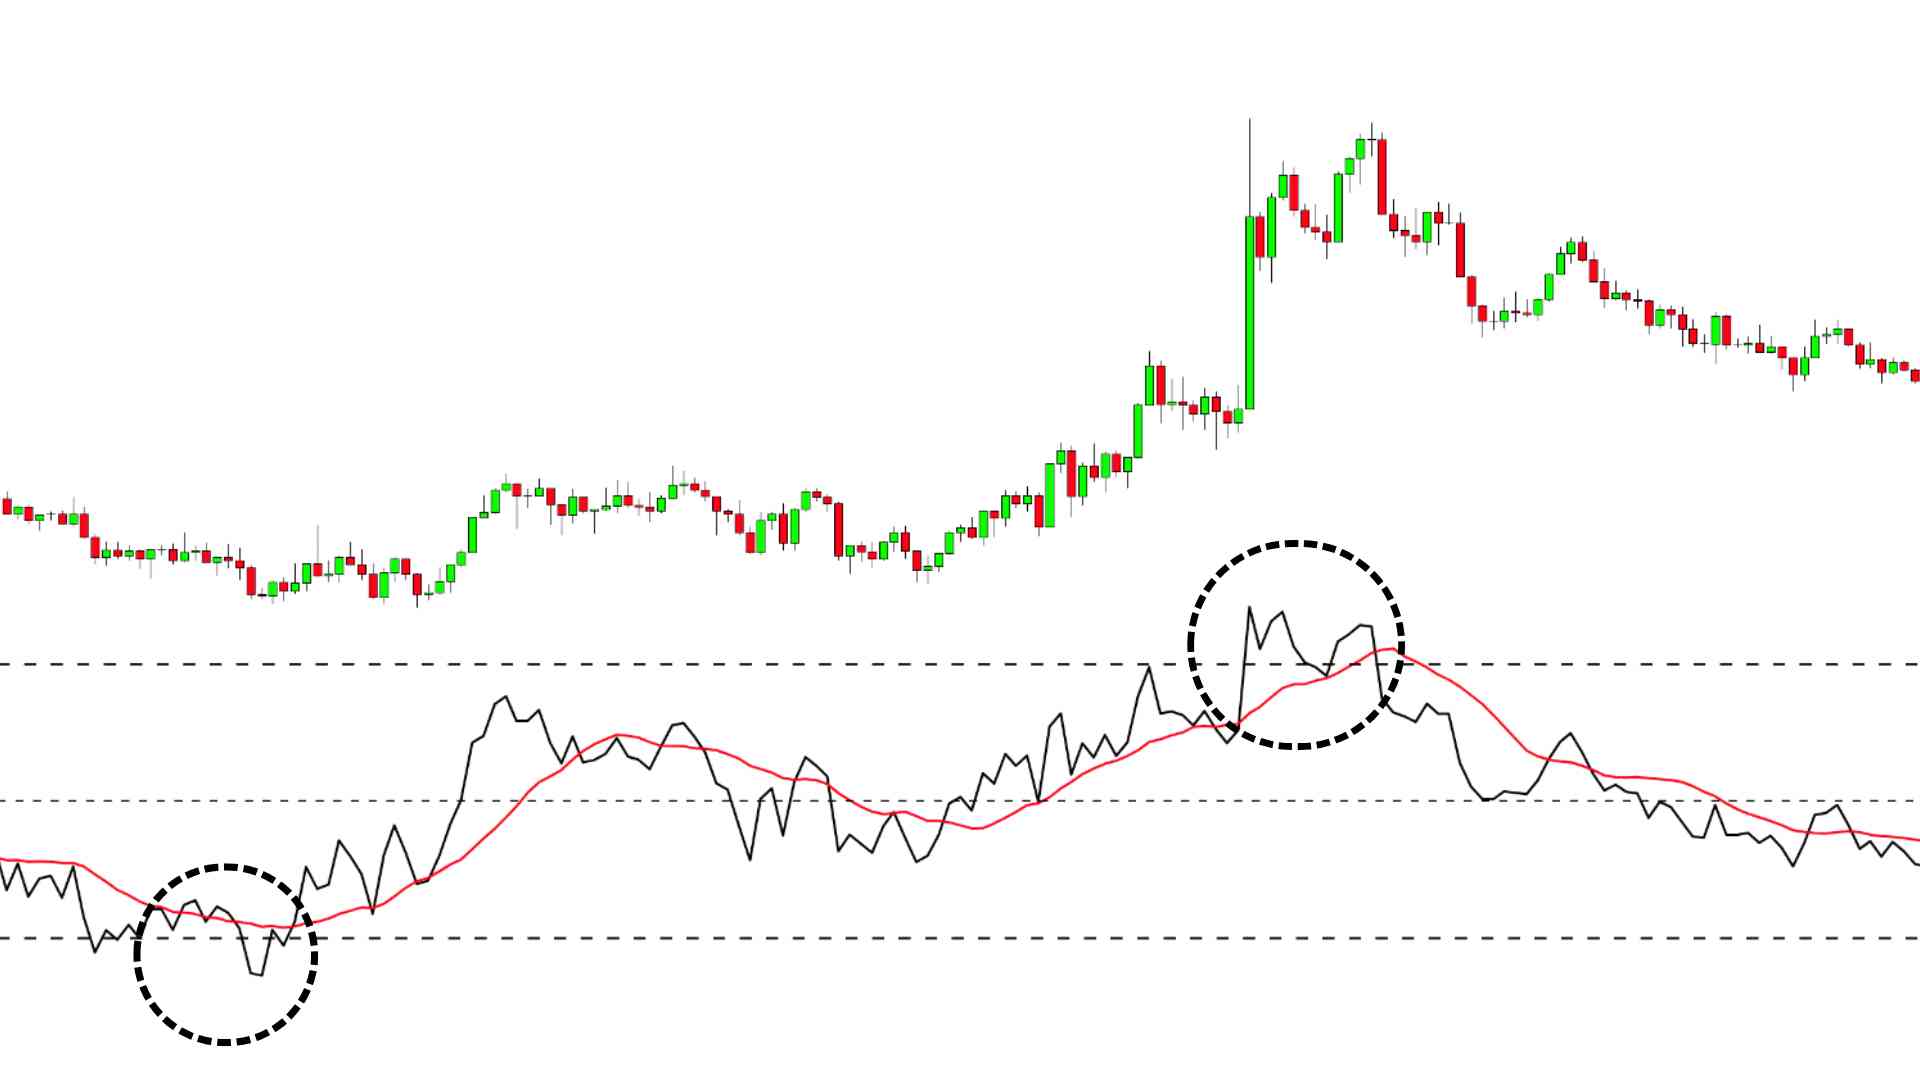
Best RSI Indicator Setting for 5 min Chart in a Sideways Market
6 period of RSI because when you are on a 5-minute chart then you have to make decisions quickly.
{Sideways Market: – When the price of any asset is unable to break particular support and resistance and keeps moving in the same zone, we call it a sideways market.}
After doing a lot of research, we have brought a result in front of you and this is that you should simply do it.
Remember: –
Whatever the RSI indicator, you should match it with the trend and if you do so, it increases your winning probability.
When you do a smaller period then your stop loss will also be less due to which the risk will not be that much when the risk is not so much then the profit target will also be less when you combine the strategies and with the perfect psychology, it will give you a better result in the long run.
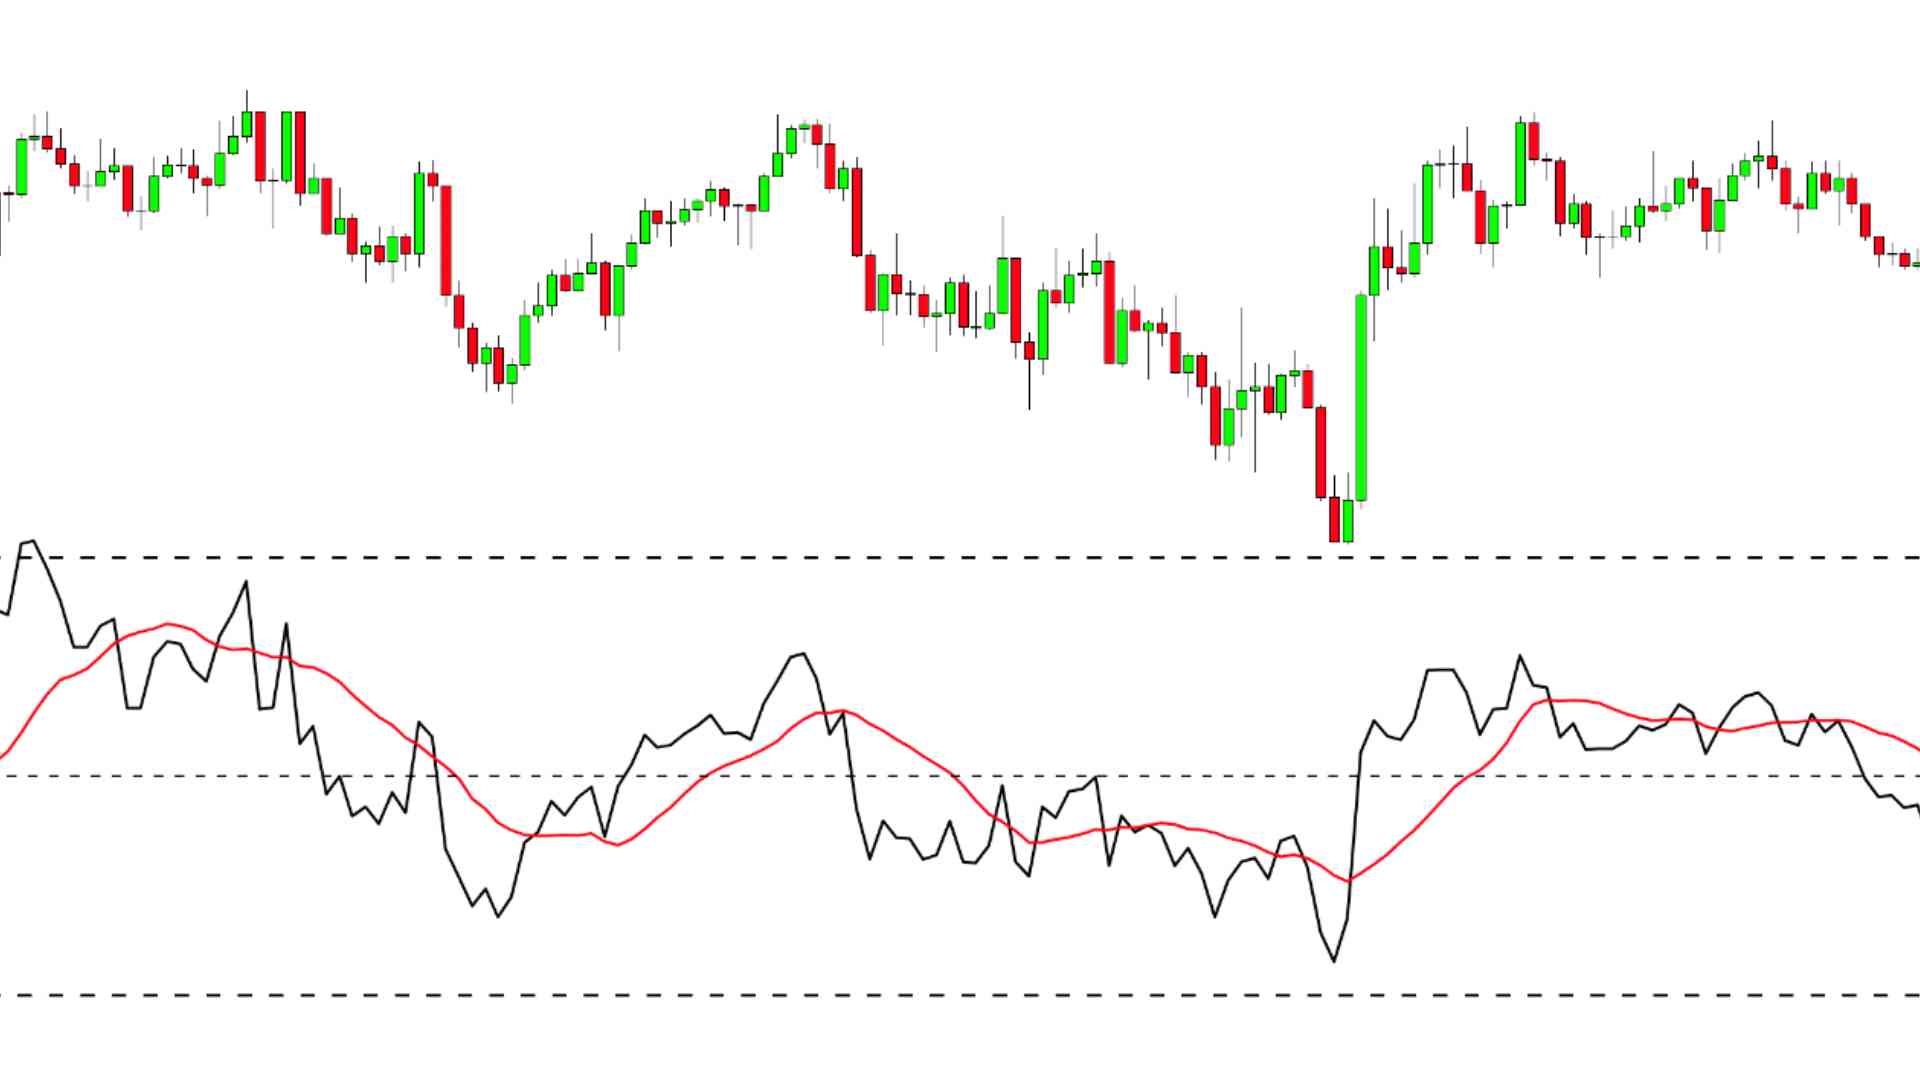
Best RSI Indicator Setting for 5 min Chart in a Trending Market
24 period of RSI is best because when you are in a trending market then you have to follow the trend and make more profits with it.
{Trending Market: – When the price of any asset breaks the support and resistance then it goes into the trading market or when the price of any asset shows a higher high and higher low or lower high and lower low then it comes into the trading market.}
Remember, whenever you do this, first read the market conditions carefully so that you know better how this is working in the market because it is certain from our research that in the trading market, you have to keep your period a little longer than 25. When you do this, it will help you to catch the trend.
If you make it less than this then the price value of any asset will quickly go into overbought and oversold, hence due to this you will miss the rest of the trend. So, make sure that you make it more than 24 periods, it is best for you.
Remember: –
Whatever the RSI indicator, you should match it with the trend and if you do so, it increases your winning probability.
And if you buy any asset at the right price and at the right time, as soon as the trading market starts in any trading market, then your risk remains very low and the profit becomes very high, which is what most traders do.
Best RSI Indicator Setting for 5 min Chart in a Volatile Market
29 period of RSI is best because, in that volatile market, the movement of the price is very fast, due to which the RSI indicator stops working anyway and even if it works.
It gives a much faster signal than it gives, due to which the trade becomes very risky. It is difficult to predict the price, you should use it over a longer period so that whatever signals it gives you in the volatile market if you buy from there, then there are higher chances that the trade will go in your direction.
{Volatile Market: – When the price of any asset shows a sharp moment and unpredictability, then we call it a volatile market in which it is not easy to understand in which direction the market is moving and which pattern it is forming.}
Remember: –
Whatever the RSI indicator, you should match it with the trend and if you do so, it increases your winning probability.
Do Profitable Traders Believe in the Best RSI Settings?
Yes, They Believe
We did a lot of research to know the answer to this question, went through a lot of forms found the answers searched a lot of websites, and talked to a lot of traders and we found something about the traders and they will live in the best settings.
Has to be changed according to the market cycle but when it comes to market stability, he prefers to stick to one setting which is his favorite.
Conclusion
I hope you liked the answer, it must have been very helpful for you.
We have tried our best to answer this question and have researched thousands of results, after which we are providing you the results.
Now I want to know you: –
What is your favorite indicator?
What setting did you use this indicator for before?
What was your experience with the RSI Indicator?
Comment Me! I’m Waiting: –
FAQs
What is the best setting for RSI?
The values of RSI also have to be changed according to the market conditions, but still, if we talk about the best then it is 6 periods for short-term trading.
What RSI setting is good for a 5-minute time frame?
6 period of RSI because when you are on a 5-minute chart then you have to make decisions quickly.
Which is better Relative Strength Index (RSI) or Commodity Channel Index (CCI)?
The relative Strength Index is widely used by professional traders so, the RSI indicator is the best.
What is the best period for RSI?
The default setting then is 14 periods. If we talk about the best period for RSI then it is 6 periods.
What is RSI 14?
It analyzes and tells us about a recent price change that is in overboard or oversold condition and its period is 14 to calculate these values.
How do I calculate RSI?
To Calculate the RSI = 100 – [100 ÷ ( 1 + (Average Gain During Up Periods ÷ Average Loss During Down Periods ))]
What is the best RSI setting for day trading?
11 Period is the best RSI setting for day trading.
What’s the best setting for a short-term RSI indicator?
6 period of RSI because when you are in a short-term chart then you have to make decisions quickly.
What is the RSI indicator?
The RSI indicator helps to indicate when the price is undervalued (below 30) or overvalued (above 70) of the assets using their low or high levels.
Leave a Reply